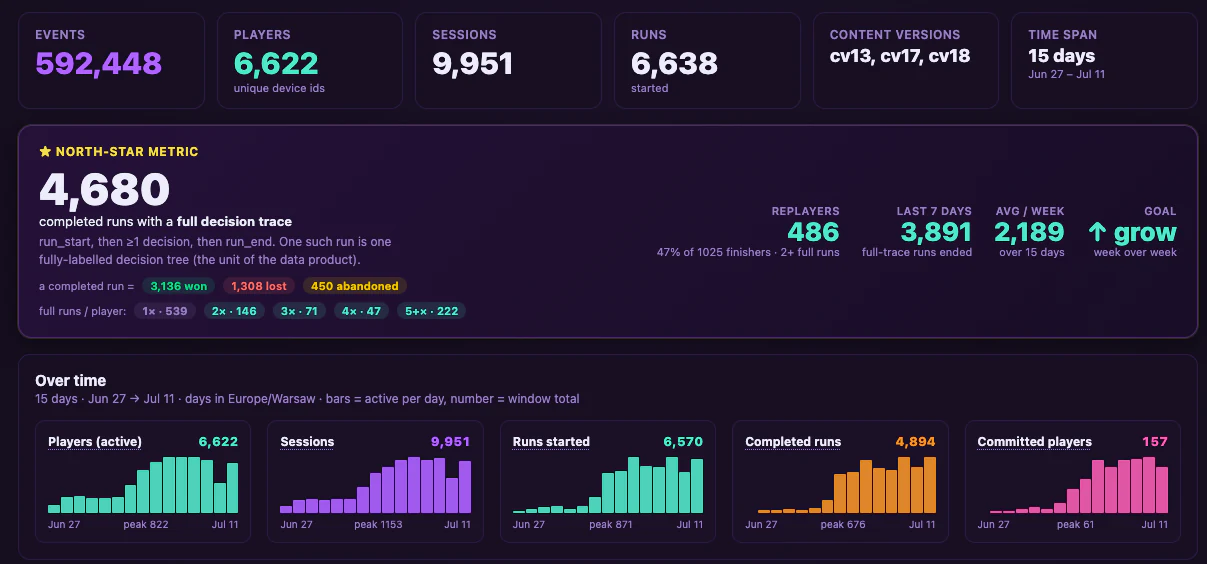
Atlas of Doors is built as a measured game. Every door you open, every card you play and every run you abandon is a logged decision, so I never have to guess how the game is doing. Three weeks in, here is the whole scoreboard: 6,622 players, 6,638 runs started, 4,894 runs played to an end, and the two leaks that are quietly costing us most. The good parts and the embarrassing parts, same page.
By the dev · July 12, 2026 · Numbers below are the measured window Jun 27 to Jul 11 (15 days of clean telemetry across content versions cv13, cv17 and cv18).
6,622
Players
9,951
Sessions
6,638
Runs started
4,894
Runs finished
157
Committed
592,448
Events logged
The short version
6,622 people opened the game and played 9,951 sessions. They started 6,638 runs and played 4,894 of them all the way to a win, a loss or a give-up.
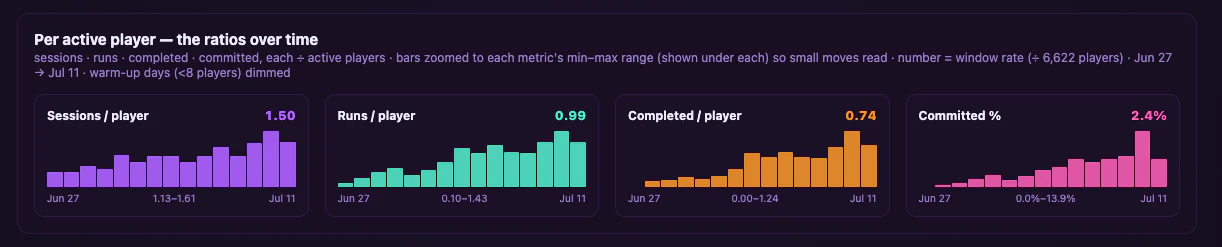
The same player now does more. Sessions per player, runs per player and finished runs per player have all climbed steadily across the window. The game got stickier per head, not just bigger.
Activation went from 24% to 34%. A third of engaged visitors now actually start a run. It was a quarter at the low point. The goal is 50%.
Sessions got 3.6x longer. Median play session went from 1.2 minutes to 4.4 minutes. People who play are staying in the dungeon.
Retention is still the weak spot. Day-1 is 4% against a 15% goal. That is the number that decides whether this game has a future, and it is not there yet.
Two leaks dominate. 61% of people who see the home screen never reach the path picker. Another 38% quit between the first door and floor 2.
And yet: 257 runs were started on the final rung of the Descent, the hardest difficulty in the game, which you can only reach by winning every rung below it. 163 of those were won.
The scoreboard
This is the dashboard I look at every morning. It reads straight from the live event stream, not from a spreadsheet I keep by hand.
15 days, three content versions, half a million events. The bars at the bottom are per day: every one of them is still climbing on the last day of the window.
What a "run" actually costs a player
A run is not a tap. It is a full descent: pick an element, open doors, fight, draft cards, get to the boss or die trying. 4,894 of them were played to a real ending:
Ending
Runs
Share of finished runs
Won
3,136
64%
Lost
1,308
27%
Abandoned
450
9%
Total finished
4,894
100%
4,680 of those 4,894 carry a complete decision trace, meaning a full record of every choice from the first door to the last. That is the north-star metric: not "views", not "installs", but fully labelled play. It is also the unit of the data product behind the game.
One number I keep re-reading
Of the 1,025 players who finished a run, 486 came back and finished another one. 222 players have five or more full runs behind them. That is the group the whole game is really being built for.
The loyal core: 157 committed players
"Committed player" is a deliberately harsh definition, because a metric you can flatter is a metric you will flatter.
The definition
A committed player is someone who:
was active on at least 2 separate days, and
averaged 10 or more active minutes on the days they played.
Active time is measured from the gaps between a player's own events, and any single gap over 3 minutes is capped, so an idle or backgrounded tab never counts as playing.
That makes 157 a deliberate lower bound. The real number of engaged people is higher, but I would rather under-count than lie to myself. Every metric on the dashboard carries its own written definition like this one, so that it cannot quietly drift between versions.
157 people cleared that bar. On a base of 6,622 that is 2.4%, and it is growing: the committed bar has gone up nearly every day of the window, peaking at 61 committed players active in a single day. A game with a real core has a shape like this. A game people bounce off does not.
The same players are playing more
Raw totals go up simply because more people arrive. The honest question is whether an average player does more today than two weeks ago. They do, on every ratio I track.
Each metric divided by active players, per day. All four lines are pointed the same way.
Per active player
Window rate
Daily range
Direction
Sessions
1.50
1.13 to 1.61
Up
Runs started
0.99
0.10 to 1.43
Up
Runs finished
0.74
0.00 to 1.24
Up
Committed share
2.4%
0% to 13.9%
Up
Read the second row again: the average person who shows up now starts roughly one full run. Early in the window it was one run per ten visitors. The updates in this period (a clearer front door, a rebuilt combat screen, a rebalanced card roster) did not just pull more people in, they made the people already here go deeper.
Activation: 24% to 34%
Activation is the share of engaged visitors who actually start a run. It is the first thing a game has to earn.
Visitor to first run. "Engaged opens" only: browser prerenders, link unfurls and headless bots are filtered out, because dividing by every mount would flatter this number.
Visitor to first run
A third of everyone who genuinely opens the game now starts a descent. At the low point it was a quarter.
34%
Now
50%
Goal
Building
Ten points of activation on this traffic is roughly 660 extra people who actually played the game instead of glancing at it and leaving. It is still the cheapest number on the board to improve, because the people are already there. They are standing at the door.
They stay 3.6x longer than they used to
Median length of sessions that actually started a run. Measuring all sessions would read near zero, because of the home-screen bounce covered below. This is depth when they play.
Median playing session
1.2 minutes on Jun 28. 4.4 minutes now. The median web game sits at 5 to 6 minutes, so we are nearly at the genre floor and climbing.
4.4 min
Now
10 min
Goal
This is the update working. A session used to be "open it, look at it, close it". A session is now "play a run". The next jump has to come from the reason to start a second run in the same sitting.
Retention: the part I am not happy about
Here is the number that decides everything, and here is us being bad at it.
Day-1 retention
Of the players old enough to count, the share who came back the next day. Mobile-web sits around a 10 to 15% floor. We are under it.
4%
Now
15%
Goal
Behind
Players who came back on another day
The coarser "seen on 2 or more distinct days" proxy. This one is climbing, which is the encouraging half of the story.
9%
Now
15%
Goal
Rising
Saying the quiet part out loud
A 4% day-1 means 96 out of 100 people who tried Atlas of Doors did not come back the next day. The newest cohort is at 7%, so it is moving the right way, but it is nowhere near the 15% a game needs to compound. Everything on the roadmap below exists to move this one number.
Where players fall out
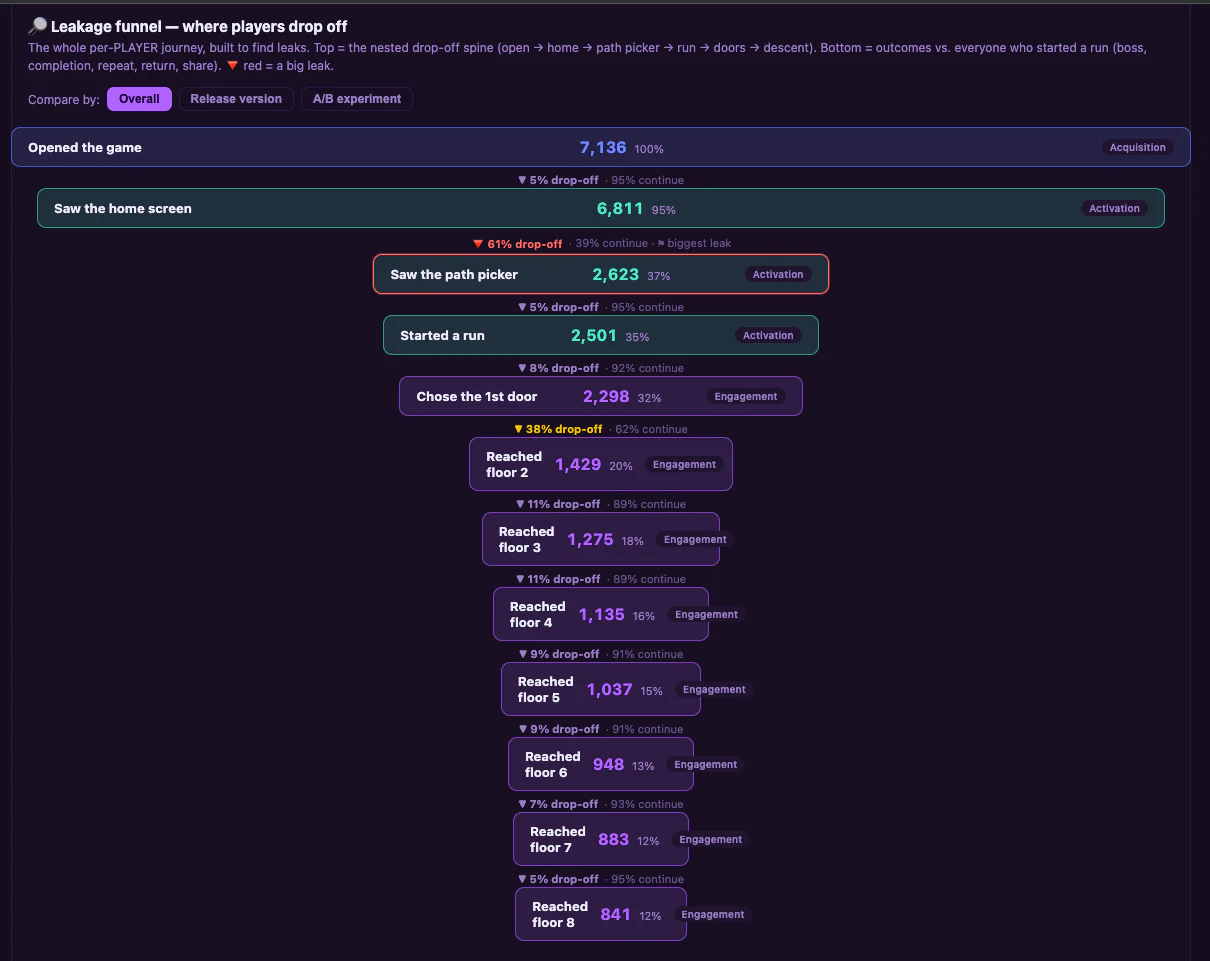
The leakage funnel walks the whole player journey and marks the steps where people leave. Two steps do almost all the damage.
Opened the game
100%
Saw the home screen
95%
-5%
Saw the path picker
37%
-61%
Started a run
35%
-5%
Chose the 1st door
32%
-8%
Reached floor 2
20%
-38%
Reached floor 3
18%
-11%
Reached floor 4
16%
-11%
Reached floor 5
15%
-9%
Reached floor 6
13%
-9%
Reached floor 7
12%
-7%
Reached floor 8 (boss)
12%
-5%
Percentages are share of everyone who opened the game. The right column is the drop-off at that step.
The same funnel on the live dashboard, with the biggest leak flagged in red.
Leak 1: the home screen, 61%
Six out of ten people who see the home screen never even reach the screen where you pick a path. They have not judged the game. They have judged a title screen. That is the single most expensive rectangle in the product, and right now it is asking people to make a decision before it has given them a reason to care.
Leak 2: the first floor, 38%
Then, of the people who start a run and open a door, nearly four in ten never reach floor 2. This is the first fight. Whatever happens in that first combat, some of it is landing as confusion rather than as a challenge. Notice how gentle every floor after that is: 11%, 11%, 9%, 9%, 7%, 5%. Once someone survives floor 1, they mostly go all the way to the boss. The game is not losing people because it is boring. It is losing them at the door.
The optimistic reading
Both big leaks are in the first 90 seconds. Neither is in the game itself. The content is holding people fine, which means the fixes are cheap and the upside compounds through every number above.
The deep end: people are beating the whole game, repeatedly
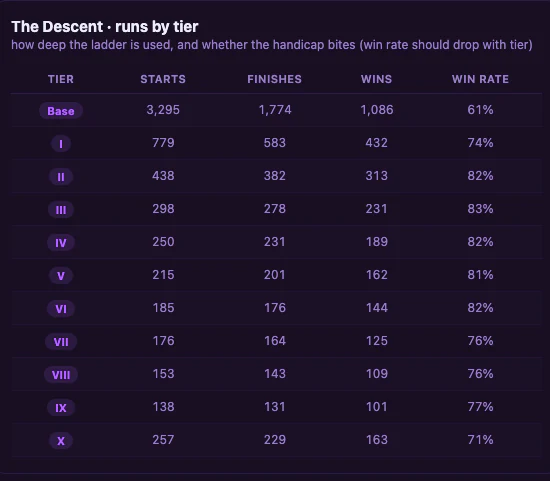
The Descent is the difficulty ladder. Every rung permanently stacks one more handicap, and you only unlock the next rung by winning the current one. Reaching the last rung means you have won the game at every difficulty below it.
Runs by Descent tier. Starts, finishes, wins, win rate.
Tier
Runs started
Finished
Won
Win rate
Base (Threshold)
3,295
1,774
1,086
61%
Descent I
779
583
432
74%
Descent II
438
382
313
82%
Descent III
298
278
231
83%
Descent IV
250
231
189
82%
Descent V
215
201
162
81%
Descent VI
185
176
144
82%
Descent VII
176
164
125
76%
Descent VIII
153
143
109
76%
Descent IX
138
131
101
77%
Descent X (the final rung)
257
229
163
71%
257 runs were started on the last rung, and 163 of them were won. These are people who have beaten the entire core game, then beaten it again nine more times with a new permanent handicap stacked on each time, and then went back for more. Look at the shape of the ladder: it narrows to about 140 runs a rung, and then the final rung jumps back up to 257. People do not climb to the top and stop. They climb to the top and live there.
What this table also tells me (the unflattering part)
The win rate rises from 61% at Base to the low 80s in the middle of the ladder. That is not the handicaps being weak. It is survivorship: the only people up there are already excellent, and they are good enough to eat a stacked handicap without noticing. Two conclusions, and I like exactly one of them:
The endgame is not too punishing. Nobody is being wall-blocked out of the ladder.
But the rungs are too gentle for the people who reach them. The ladder should bite harder near the top, and that is now a balance job.
What I fix next
Everything above collapses into one sentence: the game is good, the front door is not, and people do not come back tomorrow. So the next three weeks look like this.
1
Rebuild the front door 61% leak
The home screen has to stop being a title card and start being a trailer. Show the game, not the name of the game. Get people into a fight before they get to make a decision. Every point of activation here multiplies into every other number on this page.
2
Fix the first fight 38% leak
Floor 1 is where four in ten new players quit, while every later floor holds fine. That gap is a teaching problem, not a difficulty problem. The first combat has to explain itself while it is being played, without a tutorial wall in front of it.
3
Give people a reason to come back tomorrow 4% D1
Retention is not a popup that begs. It is a game you are in the middle of. The daily seeded run, the Descent ladder and the meta-progression all exist for this, and they are clearly not yet loud enough to pull someone back on day 2. That is the hardest and most important problem on the board.
4
Make the top of the ladder bite
An 80% win rate on Descent VI is not an endgame. The 157 committed players deserve a mountain that fights back.
Why I publish this
Because the numbers are the game. Atlas of Doors logs every decision so the design can be argued with evidence instead of taste, and it seems dishonest to use that data to make the game better and then only show you the parts that flatter it. If you have played it, you are in these charts somewhere. Tell me what made you close the tab. That is the most valuable thing anyone can give me right now.