Atlas of Doors is a roguelike deckbuilder that runs in a browser tab, with no download and no account. It is also an experiment in building a game the way you would build a product: every door opened, every card played and every run abandoned is a logged decision, so nothing about how this game is doing has to be a matter of opinion. A month later there are a million of those decisions on record. Here is what they say, including the parts I would rather they did not.
By the dev · July 19, 2026 · The telemetry window below is Jun 27 to Jul 18, 2026, 22 days of clean data across content versions cv13, cv17, cv18 and cv19. Money and shipping cover the full month.
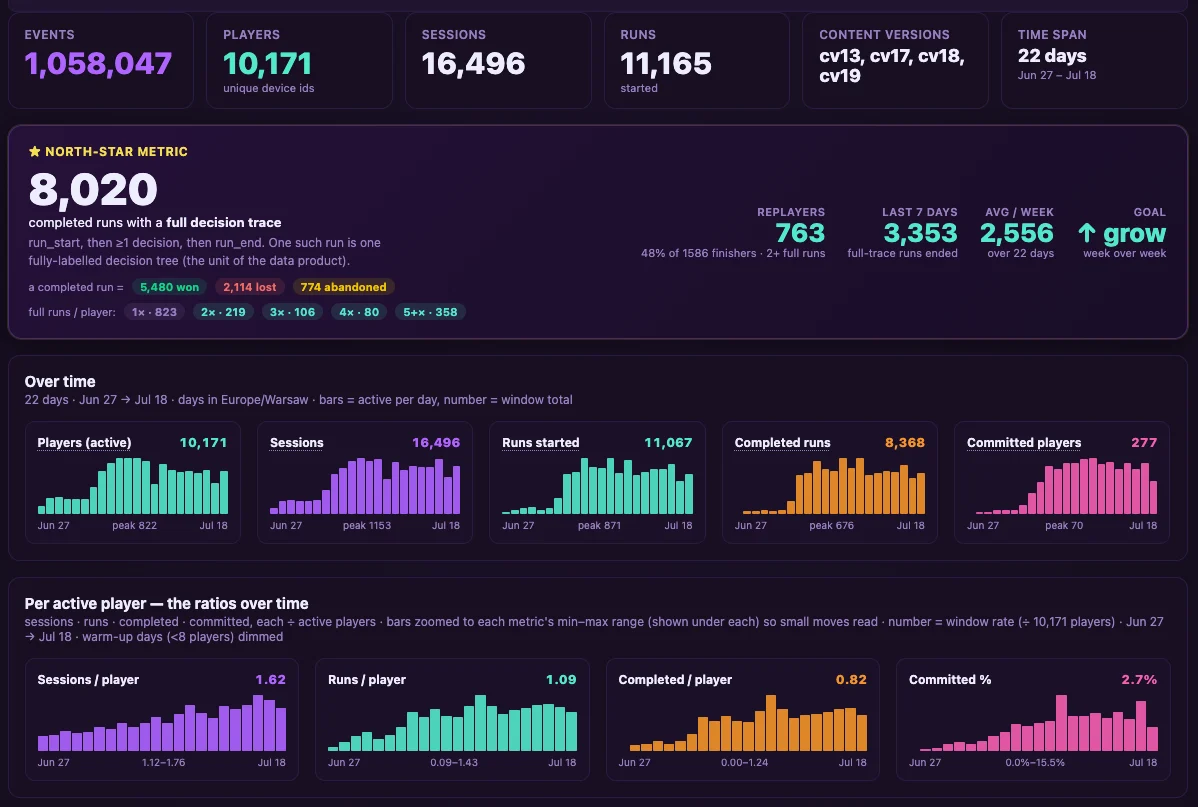
1,058,047
Events logged
10,171
Players
16,496
Sessions
11,165
Runs started
8,368
Runs finished
277
Committed
The short version
A million logged decisions. 1,058,047 events from 10,171 unique devices across 16,496 sessions. Enough data that the design arguments now have an umpire.
The same player does more than they used to. Sessions per player, runs per player and finished runs per player have all climbed steadily. The game got stickier per head, not just wider.
Activation went 25% to 35%, and it is still the single largest thing standing between us and every retention number on this page.
Retention splits in two. Pooled across everyone who opens the tab, day-1 is 4%. Among people who actually start a run, it is 9%, day-7 is 3%, and return-within-two-days is 18%, which is already past our 15% goal.
Two leaks own the funnel. 60% of people who see the home screen never reach the path picker. Another 38% quit between the first door and floor 2.
Two full seasons shipped in a month. Season II rebuilt every card and effect from scratch. Season III added 12 monsters and split the descent into three biomes.
Roughly $2,000 spent, $5 earned. $845 on Reddit ads, about $1,250 on AI, and one unsolicited coffee tip from a player which is, honestly, the number I was happiest to see.
1. A million decisions, and why we bothered
Most small games ship and then guess. This one was built decision-tree-native on purpose: the whole game is cards, doors and nodes, which means every single interaction is already a structured event. We did not add analytics later. The telemetry went in at commit one, because the data is not a reporting layer on top of the game, it is the thing that tells us which version of the game to keep.
The morning dashboard. It reads straight off the live event stream, not off a spreadsheet anyone maintains by hand.
What is actually in there
Not pageviews. The log is the shape of a decision: what options a player was shown, and which one they took. Multiply that by 11,165 started runs and you get something genuinely rare for a game this size, which is a complete, labelled record of how thousands of strangers make choices under pressure.
Signal
Count
What it tells us
Events logged
1,058,047
Every decision point, both options shown and option chosen
Unique devices
10,171
Anonymous device ids, not accounts. No sign-up wall anywhere
Sessions
16,496
More sessions than players, so a share of them come back
Runs started
11,165
A run is a full descent, not a tap
Runs with a full decision trace
8,020
The north-star. Fully labelled play, start to finish
10,171 people found it
This is the part I am quietly proud of. A month ago this game had no players, no audience, no wishlist and no press. Getting to ten thousand devices is not a mystery any more, we know how to do it and we know roughly what it costs. That is a real piece of know-how, and it is separate from the harder question, which is whether they stay. More on that shortly, because the answer is "not enough of them yet".
The ratios matter more than the totals
Totals go up simply because time passes and we keep buying traffic. Ratios do not. So the four charts at the bottom of that dashboard are the ones I actually read, because they divide by the player count and therefore cannot be flattered by spending more money.
Per active player
Now
Range over the window
Direction
Sessions / player
1.62
1.12 to 1.76
Climbing
Runs / player
1.09
0.09 to 1.43
Climbing
Completed runs / player
0.82
0.00 to 1.24
Climbing
Committed players
2.7% (277)
0.0% to 15.5%
Climbing
These moves are not dramatic. Runs per player went from roughly 0.90 to 1.10, finished runs per player from roughly 0.70 to 0.90. Call it ten percent, steadily, on a base that keeps getting diluted by a firehose of brand new traffic. That last part is what makes it meaningful: we are pouring in hundreds of first-timers a day, which drags every per-player average down, and the averages went up anyway.
A "committed player", defined
Active on two or more separate days, and averaging ten or more active minutes on the days they show up. Active minutes cap any gap over three minutes, so an idle background tab can never inflate it. By that bar, 277 people are committed to this game, up from 157 three weeks ago. It is a small number and it is the most important one on the page, because it is the only cohort that is unambiguously playing rather than sampling.
2. The seven numbers I watch
Every metric on our dashboard carries its own written definition, so it cannot quietly drift between versions and flatter us by accident. Here they are, goals included, with the ones we are failing marked as failing.
Activation: do they even start?
Of engaged human opens, meaning crawlers, link-unfurl bots and browser prerenders filtered out, 35% go on to start a run. It was 25%. That is real progress and it is nowhere near enough, because the other 65% are people who came all the way to the door and turned around. This is where the next block of work goes, and it is the highest-leverage square on the whole board for a reason I will show you in the funnel section.
Day-1 retention: the one that decides everything
4% against a 15% goal. Exact-day cohort retention: of the devices old enough to count, the share that came back the very next day. Mobile-web games generally floor around 10 to 15%, so this is not good, and lately it has been drifting down rather than up.
I have a strong suspicion about why, and it is not the build. Our current ad round is re-hitting an audience pool we have already worked hard. Those people open the game, recognise it, and leave, which is exactly what a re-served impression looks like in a retention chart. Pool depletion reads as a product regression if you do not split the data by campaign, so that is the next thing I split. Until then I am treating the dip as unproven rather than as a verdict.
Day-7 retention: the compounding one
From 1% to 2% across the window. The goal is 10%. Day-7 is the lever worth the most over time, because a change that lifts day-7 lifts it for every future cohort as well, not just for the people currently in the game. Doubling in three weeks is a genuinely good trend. I will be honest about the caveat in the predictions section rather than pretending it extrapolates cleanly.
New players per day: the tap we control
535 first-seen devices a day, for about $48 of daily ad spend. Note there is no goal set on this one, deliberately. We are not optimising for acquisition volume and we do not want to. We already ran a campaign that delivered more players more cheaply, and those players dropped off faster and enjoyed the game less than a smaller, better-matched group did. Buying a bigger number is easy. Buying a better number is the whole job.
Median session length: the daily pulse
4.5 minutes against a 10 minute goal, measured only over sessions that actually started a run. The median web game runs 5 to 6 minutes, so we are just under par and climbing.
Why this is my favourite metric
Retention answers arrive late. Day-1 needs a day, day-7 needs a week, and by the time a cohort matures you have shipped four more versions and lost track of which one caused what. Session length answers today. It moves when the game gets better and it sags when the game gets worse, and I am convinced it is an early read on the retention numbers that will not arrive for another week. If this line keeps climbing while day-1 wobbles, I trust this line.
Returning players and runs per player
9% of all devices show up on two or more separate days, against a 15% goal, and it has been rising the whole window. This is a looser measure than day-1: it does not care whether you came back tomorrow or next Tuesday, only that you came back at all. For a game with no push notifications, no email list and no install prompt, every one of those returns is somebody choosing to type the address again.
Runs per player sits at 1.1 and climbing, which is the "one more run" loop doing its job. Repetition is the whole hypothesis of a roguelike. If people replay, they stay.
3. The split that reframes every number above
Everything in the last section pools two completely different populations: people who played the game, and people who looked at a home screen and left. Since roughly two thirds of arrivals never start a run, the pooled numbers are mostly measuring the bounce. So here is the same data restricted to people who actually pressed play.
Metric
Everyone who opened
Started a run
Goal
Day-1 retention
4%
9%
15%
Day-7 retention
1%
3%
10%
Returned within 2+ days
9%
18%
15% Met
Day-1 more than doubles. Day-7 triples. And return-within-two-days lands at 18% against a 15% goal, which is the first target on this dashboard we have actually met.
What this means, stated plainly
The game is not the problem right now. The front door is. People who get past the home screen and into a run behave roughly like players of a game that works. People who never get there are dragging every headline number down with them. Which is why the next section is the only roadmap I need.
The honest caveat: this is a selection effect, not a controlled experiment. People who choose to start a run were always going to be more interested than people who did not, so converting a reluctant visitor will never produce a player as good as a naturally motivated one. But the gap is far too wide to be only selection. There is a lot of retention sitting behind that door.
4. The funnel, and the two leaks that own it
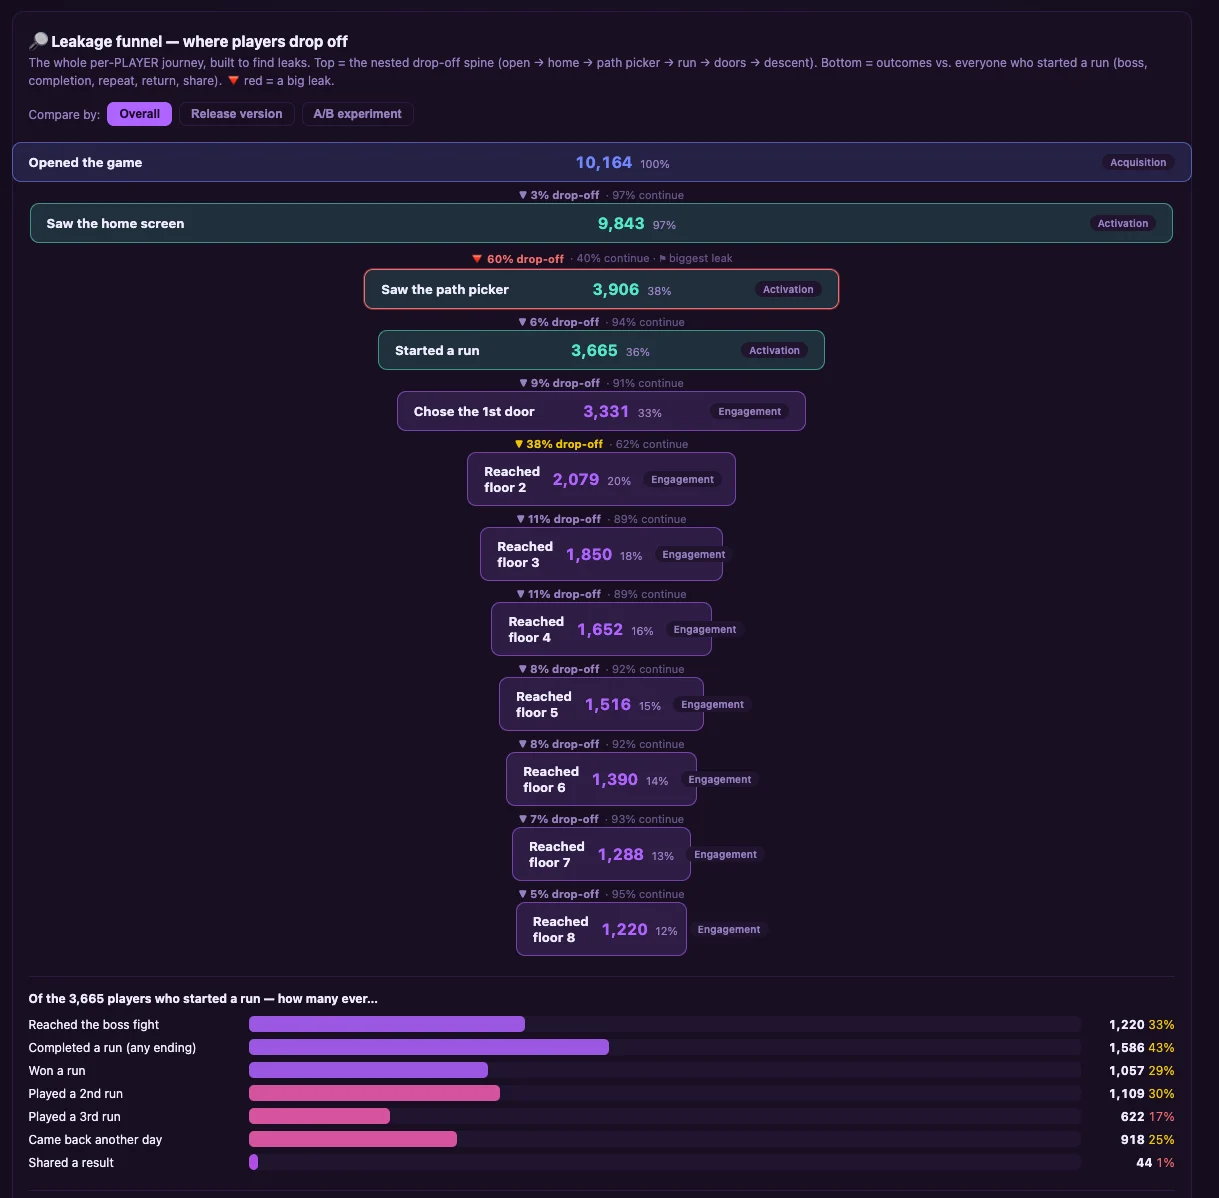
This is the whole per-player journey, nested, built for one purpose: to find where people go. Red is a big leak.
Top: the drop-off spine from open to floor 8. Bottom: what everyone who started a run ever did.
Opened the game
10,164 · 100%
Saw home screen
9,843 · 97%
3% drop
Saw path picker
3,906 · 38%
60% drop
Started a run
3,665 · 36%
6% drop
Chose 1st door
3,331 · 33%
9% drop
Reached floor 2
2,079 · 20%
38% drop
Reached floor 5
1,516 · 15%
gentle decay
Reached floor 8
1,220 · 12%
5% drop
Leak one: home screen to path picker, 60%
Six out of ten people who see the home screen never see the next screen. This is not a game problem, nobody has played anything yet. It is a first-paint, comprehension and intent problem: what is this, why should I care, and what do I press. We have made real progress here already, the home screen has been through several rounds of work, but a month-long window averages the old versions in with the new ones, so the chart understates where we actually are today. The last seven days look better than this picture does.
Leak two: first door to floor 2, 38%
The second big one, and much more interesting, because these people did play. They picked an element, opened a door, and then a bit less than four in ten stopped before the second floor. Something in that first fight or first reward is losing people who had already decided to try. We have improved it and it is still the second-largest hole in the game.
What the people who stayed actually did
Of the 3,665 who started a run, how many ever...
Count
Share
Completed a run, any ending
1,586
43%
Reached the boss fight
1,220
33%
Played a second run
1,109
30%
Won a run
1,057
29%
Came back another day
918
25%
Played a third run
622
17%
Shared a result
44
1%
Thirty percent play a second run and a quarter come back on a different day. That is a game people like. One percent share anything, which is a game nobody is telling their friends about, and that is a separate problem for a separate month.
5. The signals that are not numbers
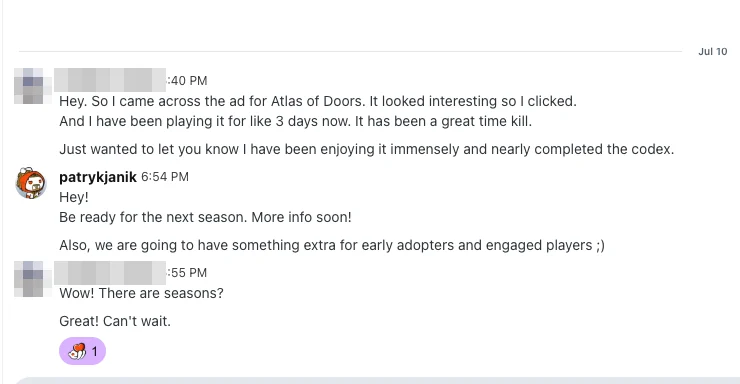
A dashboard will never tell you that somebody enjoyed themselves. For that you have to read your messages.
Unsolicited, from an ad click. Usernames blurred. Jul 10.
"I came across the ad for Atlas of Doors. It looked interesting so I clicked. And I have been playing it for like 3 days now. It has been a great time kill. Just wanted to let you know I have been enjoying it immensely and nearly completed the codex."
A player, unprompted, three days after an ad click
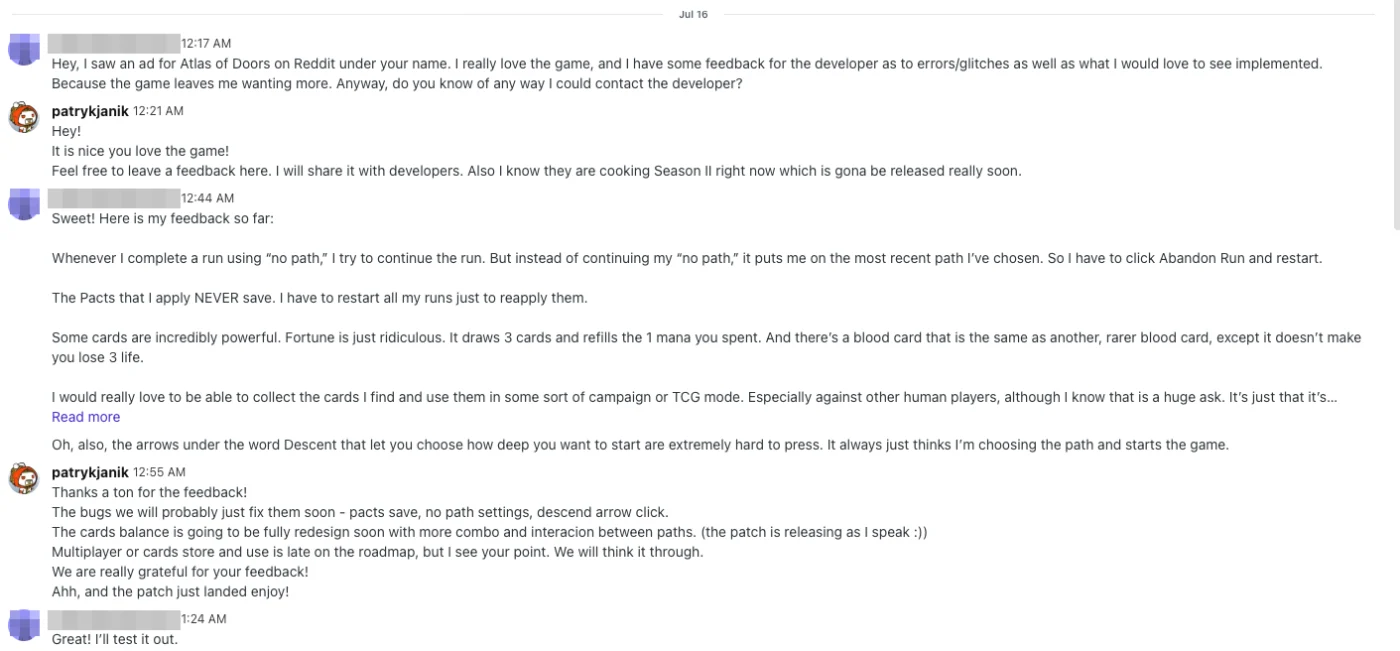
The second one is better, because it is not a compliment. Somebody tracked me down specifically to file bug reports, at midnight, and then stayed to argue about card balance.
Four real bugs, a balance complaint and a feature request. Every bug named here has since been fixed. Usernames blurred. Jul 16.
"I really love the game, and I have some feedback for the developer as to errors/glitches as well as what I would love to see implemented. Because the game leaves me wanting more."
The most useful message we have received
People who complain in detail are people who care. That message produced a patch: no-path runs no longer snap you back onto your previous path, Pacts persist properly, and the Descent arrows are actually pressable. The card balance point turned into a full rebuild, which became Season II.
A forum, and a slower plan for community
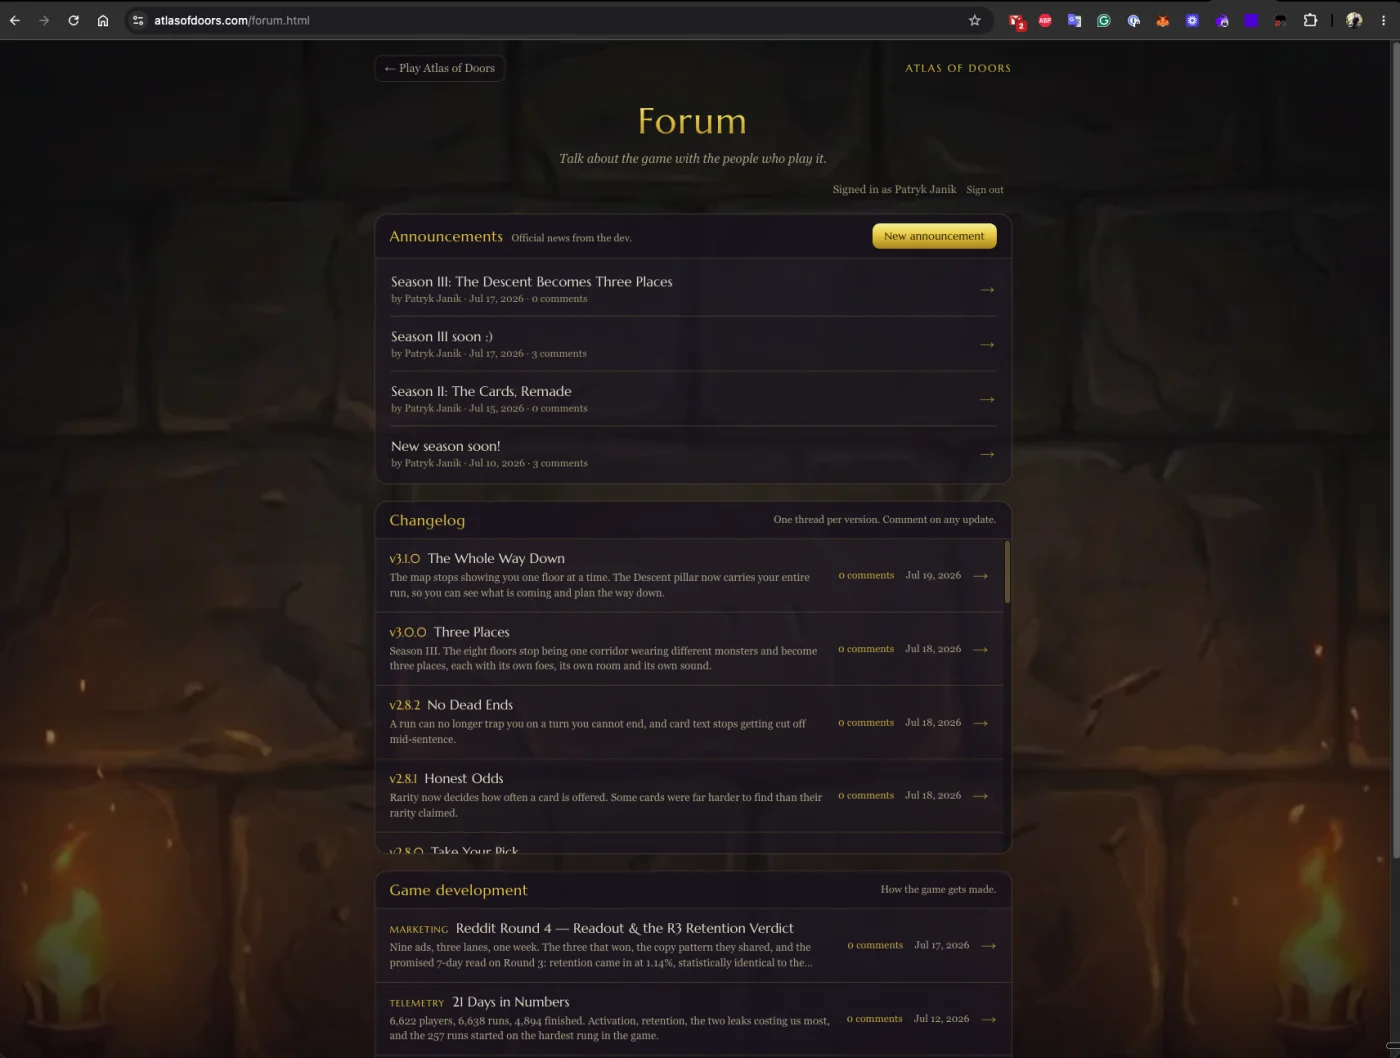
atlasofdoors.com/forum.html: announcements, a thread per released version, and these write-ups. Players comment on any of them.
We opened a forum so there is somewhere to talk that we do not control the tone of. Announcements, a changelog thread per version, dev write-ups like this one, and player-started discussion. A private Discord is on the plan for later. Being straight about it: we are moving slower on community than we probably should be, and it is a deliberate trade rather than an oversight. Building in public costs time that currently goes into the build.
6. Two full seasons in a month
Content velocity is the one advantage a very small team actually has, so we spent it.
Season II: The Cards, Remade
Every card and every effect rebuilt from scratch. Not tuned, rebuilt: new keywords, new interactions between paths, and a deliberate design spine where each archetype owns a complete internal loop instead of borrowing bits from the others. This is the answer to that "some cards are incredibly powerful" message.
12 new monsters and 3 new biomes. Before this, the eight floors of the descent were one corridor wearing different monsters. Now they are three distinct places, each with its own foes, its own room and its own sound.
Both landed inside the measurement window, which is worth remembering when reading any trend line above: the game people played on Jun 27 is not the game people played on Jul 18.
7. The money burned, and the five dollars earned
Roughly $2,000 out. Five dollars in. Here is exactly where it went.
AI, mostly images
~$1,250
Reddit ads
$845.84
Revenue
$5.00
The AI bill, and the expensive lesson in it
About $1,250, of which roughly 70% was image generation, 10% video, and 20% ordinary coding assistance. Most of that image spend was simply wasted: we generated at resolutions far higher than the game will ever display, with no batching and no optimisation pass, which is a beginner's mistake that costs real money at volume.
We now burn several times less for the same output. Icons are generated five to an image in one call instead of five calls. Every generated asset goes through an optimisation pipeline that produces a mobile-sized WebP. We measure the target aspect ratio before generating rather than cropping afterwards. The tools got better because the bill got embarrassing.
For the curious: Gemini (Nano Banana Pro) for images, Veo 3.1 for video, and Claude Code on a Max subscription for the engineering, run as agentic loops rather than as a chat window.
The ad bill
Five rounds, 1.56 million impressions, 11,376 clicks, $0.07 a click. Round 5 is live now.
$845.84 total across five rounds. Our hard monthly ceiling is $1,250 and we are comfortably under it. That budget is not trying to build a business, it is buying answers: enough real players to read retention honestly, enough traffic to A/B test against, and enough reach that the game has an audience to talk to.
The first five dollars
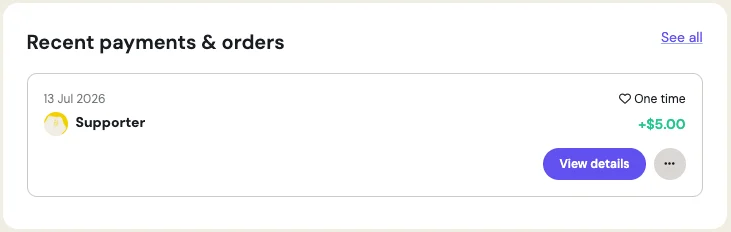
Jul 13. One person, unprompted, on a game that has never asked anyone for money.
The game is free, has no payments wired in, and does not ask. Somebody tipped five dollars anyway. Measured against a $2,000 burn this is a rounding error, and I am not going to pretend otherwise. But someone choosing to hand money to a free browser game in its first month, with nothing to buy and nothing to unlock, is the cleanest willingness-to-pay signal available at this stage. It is the number I was happiest to see.
8. Selling it, eventually
There is no monetisation in the game today and that is deliberate. Free removes every excuse not to play, which is exactly what you want while the thing you are optimising is retention. But we are testing the distribution paths now, because most of them take longer to open than to use.
CrazyGames: the first submission is not going to make it
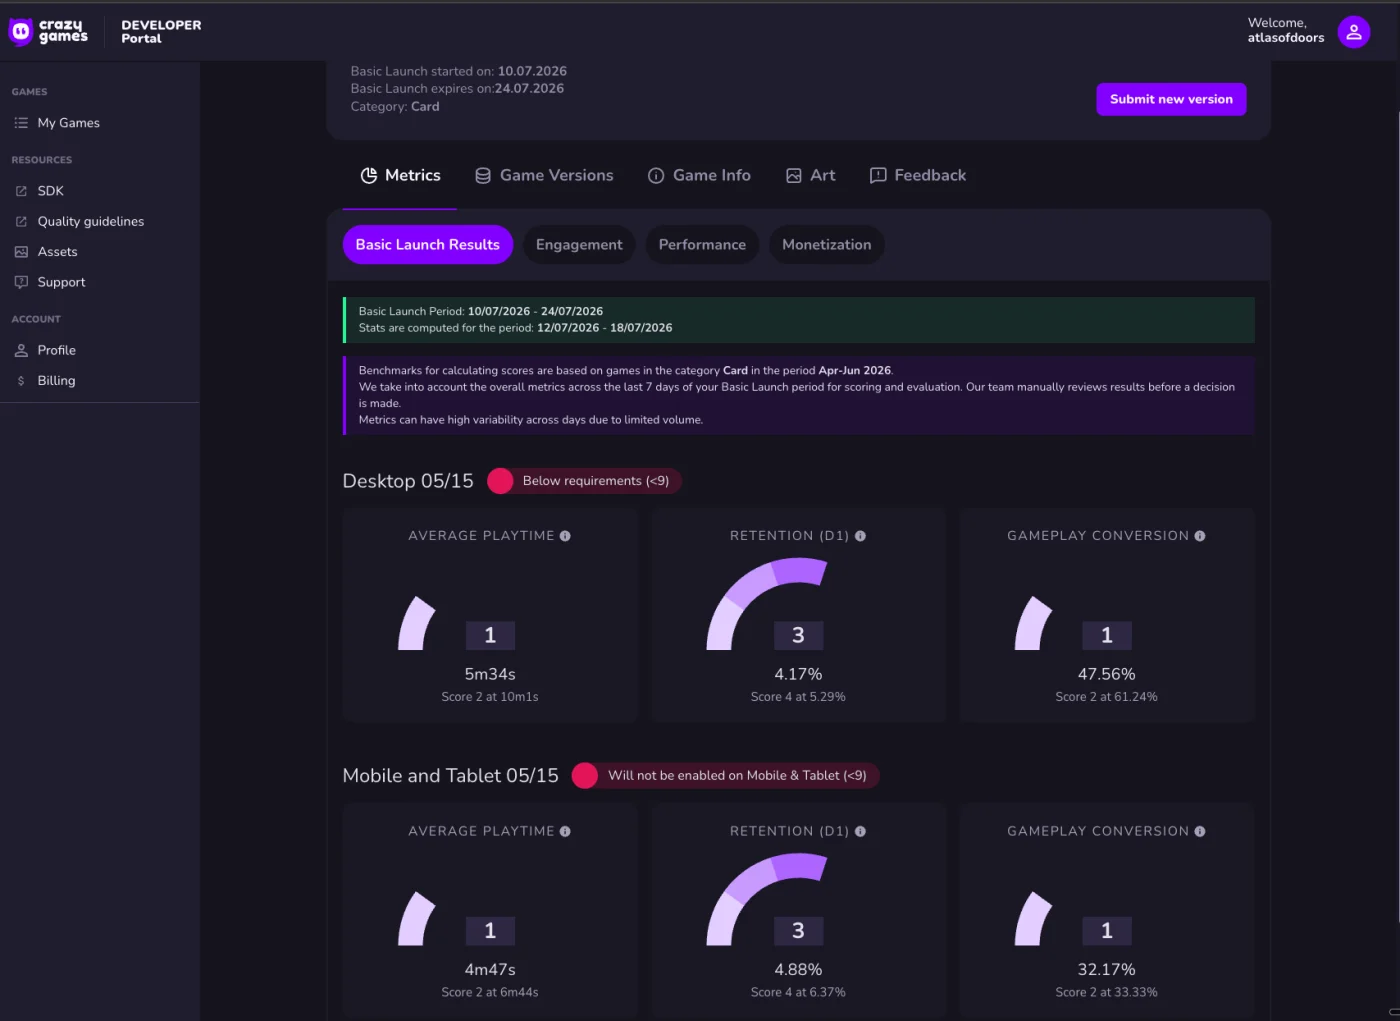
Basic Launch, Jul 10 to Jul 24. Scoring 5 out of 15 on both desktop and mobile against the Card category benchmark.
Our first version went into CrazyGames' Basic Launch and started well. Two weeks in, it is not going to clear the bar. Playtime scores 1 out of 5 (5m34s desktop, needing 10m1s for even the next rung), gameplay conversion scores 1 (47.56%, needing 61.24%), and retention scores 3 (4.17%, needing 5.29% for a 4).
The useful part
Those three metrics are, almost exactly, the three metrics our own dashboard says are our weakest: session length, activation, day-1. An entirely independent platform, measuring our game with its own tooling against its own category benchmark, produced the same diagnosis we did. That is worth more than a pass would have been. We shipped fast, got graded by someone who does not care about our feelings, and now know precisely what to fix.
A newer version is already uploaded and waiting on review, and several further improvements are built but unpublished. In any failure there is a lesson, provided you actually read it.
Where this could sell, and where it stands
In reviewCrazyGames
Web portal distribution, revenue share. First submission grading below bar, newer build submitted.
Next upGoogle Play, paid
The publishing process is long, so this one gets started sooner rather than later purely for calendar reasons.
LaterApple App Store, paid
Same logic, higher bar, later start.
LaterSteam wishlist, paid
Including a Steam Deck build. Wishlists compound, so opening this early has value even if the release is far off.
InvestigatingReddit Games and YouTube Playables
Both are embedded-play platforms where our audience already is. Availability and regional restrictions still being checked.
Designed, unbuiltContent packs
New archetypes, events and seasons, sold as packs. Every card and event in this game is already JSON with a pack id, so the engine has been built for this from day one.
Designed, unbuiltCosmetics
Card backs, door skins. Cosmetic only, always with a visible real-money price, never affecting odds or difficulty.
Under considerationSeason pass
Fits the season cadence we are already shipping at.
The goal is not revenue this quarter. The goal is to get an early, honest read on whether anyone would pay, because how you would sell a thing changes what you build. We are not rushing it, and we are not going to wire payments into a game that has not earned its retention yet.
9. How we actually market this
Five rounds of Reddit ads in a month. Round 5 is live and running the winners from Round 4 for the next seven days, after which we re-cut based on whatever the ad centre tells us.
The operating principle is uncomfortable but it has held up every round: the ads that work today will not work tomorrow. Audience pools deplete. Creative fatigues. A hook that beat everything in round three can lose to a worse hook in round five simply because the people it appeals to have already seen it four times. So we do not get attached: not to an ad, not to a creative angle, not to a channel, not to a tool.
Move fast, measure, re-cut
Ship a round, read the data, keep the winners, kill the rest, ship the next round. It is not clever and it does not need to be. The compounding does not come from finding one perfect ad, it comes from never spending a second week on a losing one.
One hard-won reading lesson from round four: better hooks bought us better first days and precisely zero extra second weeks. Round 3's winners lifted clicks and did nothing measurable to retention at day 7, which came in at 1.14%, statistically identical to the campaign those hooks had beaten. Acquisition cannot buy retention. You can buy a bigger top of funnel all day long, and the game still has to do the rest.
We are staying on Reddit for now. Not out of loyalty, but because the cost per player is satisfying and the audience fit is good, so there is no reason to spend attention on a second channel while the first still has room. Other channels come later, once there is a retention number worth pouring traffic into.
10. Predictions, and what would prove me wrong
Writing these down so they can be checked against reality next month rather than quietly forgotten.
Prediction 1
Activation work lifts pooled day-1 to roughly 5%, on its own
Pooled day-1 is roughly activation multiplied by player day-1. At 36% activation and 9% player day-1 that is about 3.2%, which brackets the 4% we see. Push activation to the 50% goal, change nothing else about the game, and pooled day-1 should land near 4.5 to 5%.
Confidence: high. It is arithmetic, not a hypothesis.
Prediction 2
Hitting the 15% day-1 goal needs both levers, not one
Even at 100% activation, 9% player day-1 caps pooled day-1 at 9%. The 15% goal is unreachable by fixing the front door alone. It requires the first fight and first reward to get materially better too, which is the second funnel leak.
Confidence: high. Same arithmetic, read as a ceiling.
Prediction 3
Day-7 will keep rising, and will not keep doubling
Day-7 went 1% to 2% in three weeks. The tempting extrapolation says 10% in about seven more weeks. I do not believe it. Early doubling off a tiny base is the easiest doubling there is, and it decelerates. My actual call: 3 to 4% pooled by the end of next month, which would be excellent and is not 10%.
Confidence: medium. Stated deliberately against our own optimism.
Prediction 4
Median session length crosses 6 minutes before day-1 crosses 6%
Session length responds to build quality within days. Retention responds within weeks, and only for cohorts acquired after the change. If both are moving, the fast indicator moves first. If session length climbs and retention does not follow within two weeks, my model is wrong and I will say so.
Confidence: medium. This one is the real test of the thesis.
Prediction 5
Committed players roughly double again
157 to 277 in three weeks, while daily new-player volume stayed roughly flat. If activation improves at all, the committed count should reach 450 to 600 next month. This is the cohort I would trade every vanity metric for.
Confidence: medium-high.
Prediction 6
Sharing stays broken until we design for it
1% share rate will not improve by itself, because nothing in the game currently gives a player a reason or a moment to share. This will still be 1% next month unless it becomes somebody's actual project, and it is not scheduled to be.
Confidence: high, and slightly annoying to write.
11. What happens next
1
Attack the activation layer
Six in ten people leave at the home screen. This is the largest single block of value on the board and everything downstream is gated by it. Expect first-paint work, clearer comprehension of what this game is within five seconds, and a shorter path from arriving to playing.
2
Fix the first-fight leak
The 38% who quit between the first door and floor 2 had already decided to play. Whatever is losing them is a first-run experience problem, not a difficulty problem, and it is the second-biggest hole in the game.
3
Season IV, with bosses that mean something
More content, and specifically new bosses paired to the descent rungs, currently being designed. The top of the ladder should fight back harder than it does.
4
Split the retention data by campaign
Before blaming the build for the day-1 dip, prove it is not an acquisition mix shift. This is a day of analysis that could save a month of chasing the wrong problem.
5
Start the store paperwork
Google Play first, because the publishing pipeline is long and there is no reason for the calendar to be the bottleneck later.
6
Keep fixing bugs, and keep enjoying this
Which is not a filler item. A month in, with a million events logged, two seasons shipped and five dollars earned, the thing that determines whether there is a second month is whether the people building it still want to.
Why we publish the bad numbers too
Because the numbers are the game. Atlas of Doors logs every decision so that design can be argued with evidence instead of taste, and it would be dishonest to use that data to make the game better and then only show you the flattering half. Day-1 is 4% against a 15% goal. Six in ten people leave before they play. One percent share. If you have played this game you are somewhere in these charts, and if you closed the tab, the reason you closed it is the single most valuable thing anyone could tell us right now.