What we can — and cannot — statistically confirm
The single most important discipline here: a metric is only usable if it has enough events to beat noise. This test is over-powered at the top of the funnel and under-powered at the bottom. Treat each tier accordingly.
CTR Confirmed
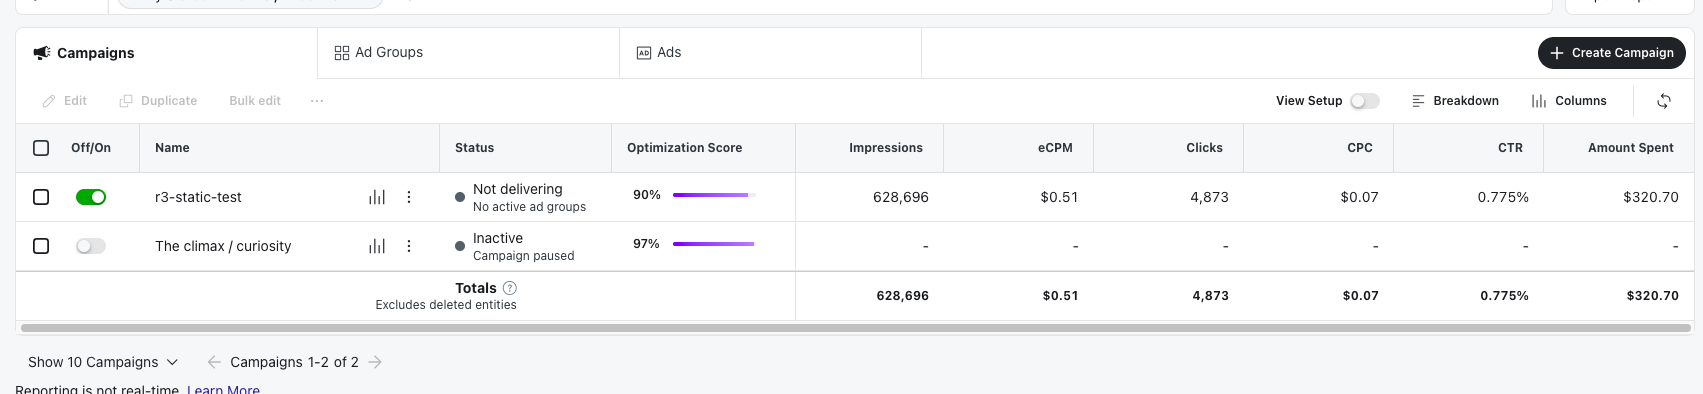
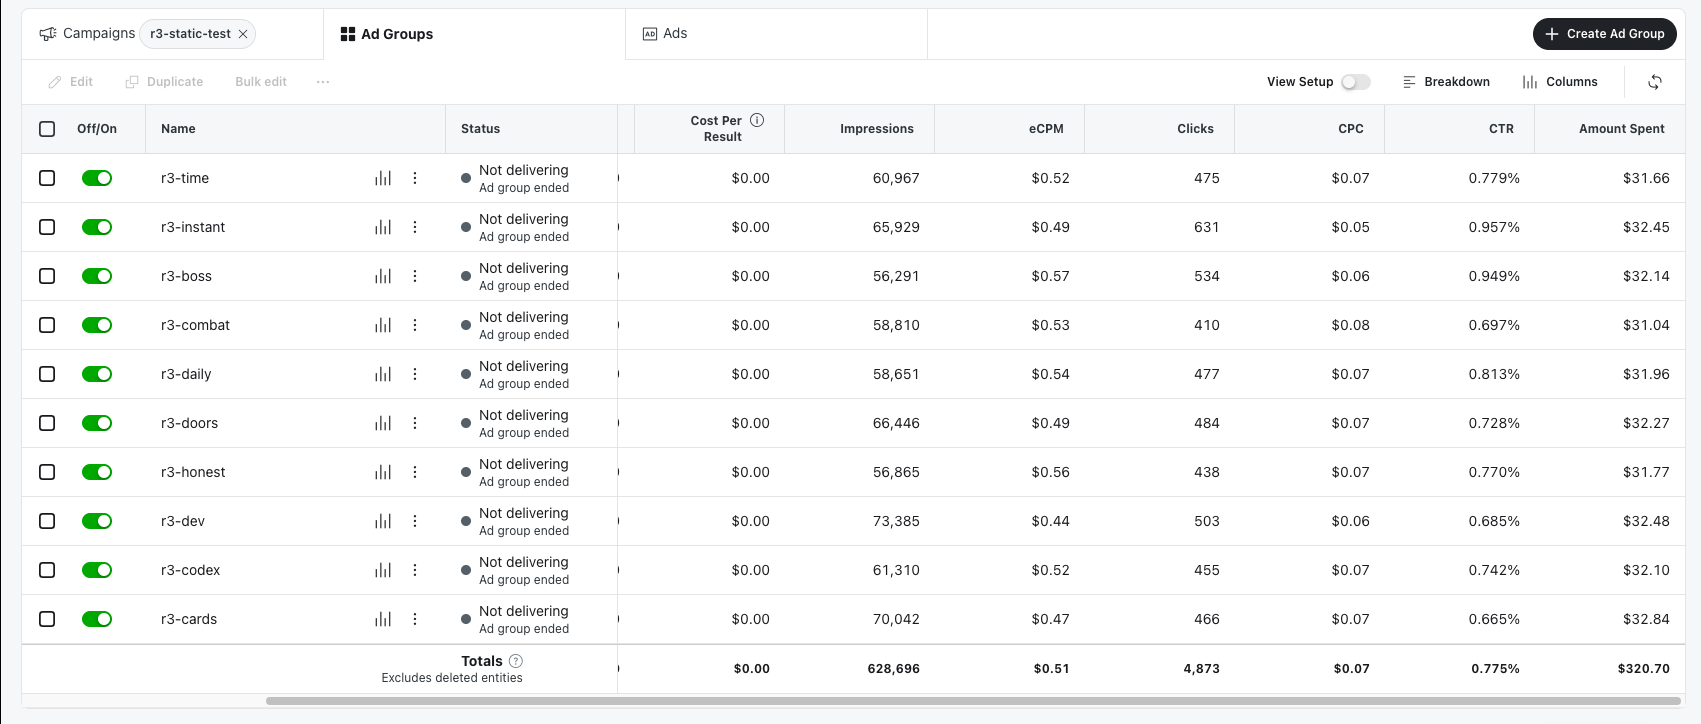
56k–73k impressions per ad. Differences at the extremes are unambiguous.
instant 0.957% vs cards 0.665% → z ≈ 6.0, p < 1e-8. Real.
The catch: instant (0.957%) and boss (0.949%) are a statistical tie on CTR — and that tie is the whole lesson. Clicks are cheap and easy to win; they do not tell you who plays.
Completion rate Confirmed
23 to ~150 completers per ad — enough to separate tiers cleanly. This is the most decision-useful confirmed metric.
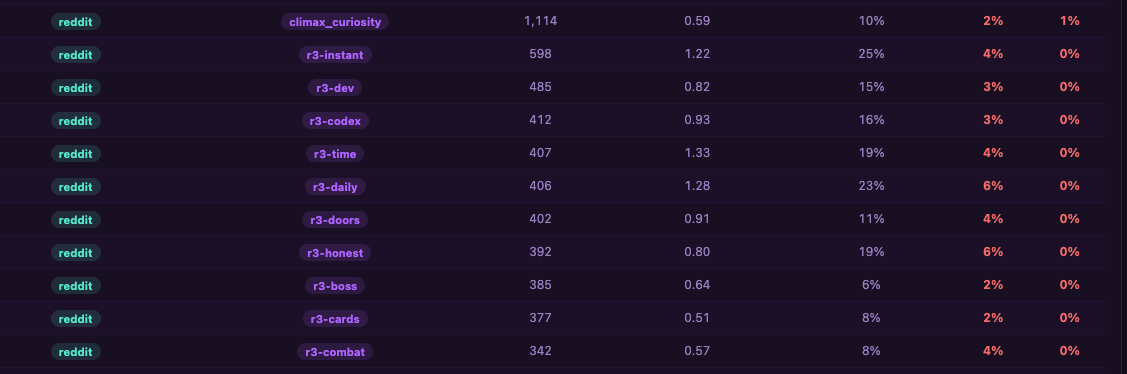
instant 25% [CI ~21.6–28.7] vs boss 6% [CI ~4.1–8.9] → z ≈ 8.9, p < 1e-16. Non-overlapping.
Top tier (instant, daily) separates cleanly from the bottom (boss, cards, combat). The cost-per-engaged-player spread of 6.4× (instant $0.22 → boss $1.39) is robust in direction.
D1 retention Suggestive only
Only 8–24 returners per ad. The best-band vs worst-band gap is real-ish; nothing finer is.
daily 6% vs cards 2% → z ≈ 2.9, raw p ≈ 0.004.
BUT 10 ads = 45 comparisons; the multiple-comparison threshold is p ≈ 0.001 (z ≈ 3.3). The gap does NOT clear it.
Use D1 as a directional tiebreaker (a “top-band” of daily/honest vs a “bottom-band” of boss/cards), never to rank ads one-by-one. The dashboard also rounds D1 to whole %, adding ±0.5% slop.
D7 retention Not yet measurable
Every R3 ad reads 0% because on Jul 10 only the Jul-3 sub-cohort has aged a full 7 days — a tiny slice with ~0 returners. This is “too early,” not “confirmed zero.”
Best available read = the matured prior campaign climax_curiosity:
D7 = 1% (~11 of 1,114) [CI ~0.5–1.8%], with D1 = 2%.
R3 winners have 3× that D1 (6% vs 2%) → IF the ratio holds, R3 winner D7 ≈ 1.5–3%. Extrapolation, not measured.
Action: re-read R3’s real D7 on/after Jul 16 (the last cohort matures then). Pausing spend does not stop D7 from maturing on players already acquired.
The in-app funnel Confirmed — and it’s the real story
From the raw event stream, the single biggest drop in the whole funnel is one rung:
TITLE → PATH-PICKER: 61% of all landed players never reach the picker.
Winners reach it 51.7% vs losers 19.7% (z ≈ 16).
But once a run STARTS, the run-2 rate is identical: 27.7% vs 27.2% (z ≈ 0.14).
Meaning: the ad only changes click-quality at the top. The game converts everyone’s starters equally well. So retention is a title-screen + return-hook problem, not an ad problem. Bad ads buy curiosity-clickers who bounce the instant they see the real game.